ParkSmart –
Data Analytics Engine
Parking Activity into
Actionable Intelligence
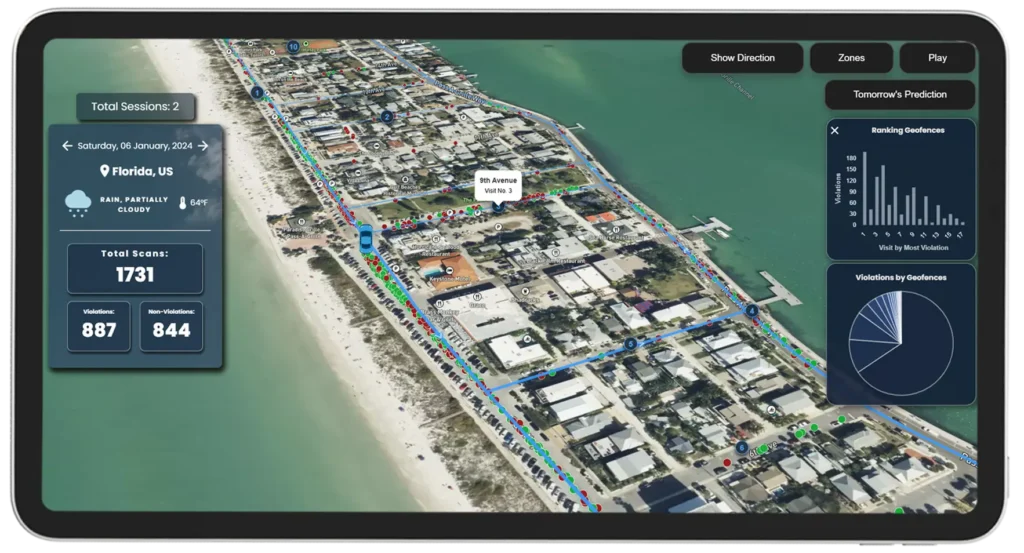
Leverage the power of real-time and historical data to optimize space usage, manage demand, and improve decision-making. The ParkSmart Data Analytics Engine helps you understand how your parking infrastructure is used — by the hour, by zone, and by user type.
Core Features
Occupancy Heat Map
Visualize areas with the highest traffic and longest dwell times. Heat maps offer intuitive insights into usage density across zones and time periods.
Occupancy Trends by Zone
Monitor how different areas are utilized throughout the day or week. Identify consistently full or underused sections to inform policy or layout changes.
Time-Based Parking Analytics
Analyze occupancy patterns across hours, days, or months. Discover daily peaks, off-peak usage, and seasonal variations.
Parking Turnover Rate
Measure how often a space becomes available and is reused. This metric helps assess efficiency and spot potential enforcement issues.
Occupancy Duration Analysis
Track how long vehicles typically remain parked in a spot. Identify long-term vs short-term usage and evaluate time-restricted zone effectiveness.
Zone & Type Comparison
Compare performance across zones, parking types (e.g., general vs valet), or locations to understand demand distribution and allocate resources smartly.
Parking Type Usage Insights
Visualize and break down data by categories such as Reserved, Handicap, Valet, Patient, or General. Adjust allocations based on real-world trends.
Forecasting & Predictive Analytics
Use historical parking data to anticipate future demand, plan resources, and improve system performance
Weather-Based Usage Correlation
See how weather conditions affect parking demand. Identify rain-sensitive or high-temperature trends that impact visitor behavior.
Custom Filters & Query Builder
Segment your data by date, time, zone, type, or user category. Build custom views tailored to your operational or strategic needs.
Downloadable Reports
Export detailed data sets or graphical reports in Excel, CSV, or PDF format. Ideal for board presentations, audits, or continuous improvement tracking.
Live KPI Dashboard
Monitor key performance indicators in real-time, such as current occupancy %, average dwell time, turnover per hour, and more
Why Use the Analytics Engine?
Make confident, data-driven decisions
Reveal patterns not visible in raw dashboards
Improve zone allocation, pricing models, and user experience
Eliminate guesswork in managing high-traffic areas
Benchmark locations and standardize best practices
Save time with ready-to-export visual reports
Ideal For


Frequently Asked Questions
Can I generate daily and weekly reports automatically?
You can schedule automated report generation and delivery by email in preferred formats.
Does this work across multiple sites?
You can compare and analyze multiple facilities, zones, or campuses within a unified dashboard.
Can I apply filters to see only valet or reserved parking trends?
Absolutely. The system supports advanced filtering by parking type, zone, or time frame.
Can I export charts as part of the reports?
Visualizations such as heat maps, trend graphs, and tables are included in exported reports.
Can I see future demand predictions?
Yes, with the Pro Tier you can access predictive models based on historical usage trends.